

by Calculated Risk on 6/17/2025 05:31:00 PM
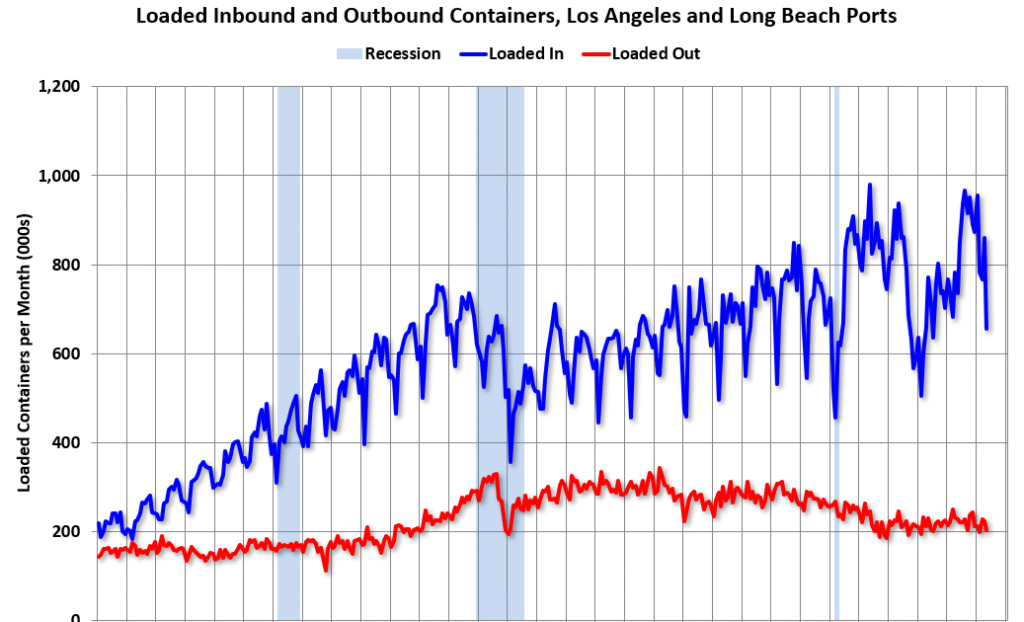
Container traffic gives us an idea about the volume of goods being exported and imported – and usually some hints about the trade report since LA area ports handle about 40% of the nation’s container port traffic.
The following graphs are for inbound and outbound traffic at the ports of Los Angeles and Long Beach in TEUs (TEUs: 20-foot equivalent units or 20-foot-long cargo container).


Usually imports peak in the July to October period as retailers import goods for the Christmas holiday and then decline sharply and bottom in the Winter depending on the timing of the Chinese New Year.
Imports were down 11% YoY in May and exports were also down 11% YoY.
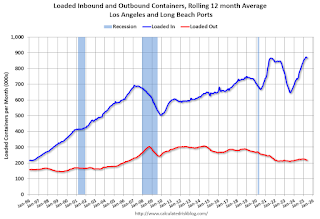
To remove the strong seasonal component for inbound traffic, the second graph shows the rolling 12-month average.

Earlier this year, importers rushed to beat the tariffs. Port traffic will likely be much slower for the remainder of this year.