

by Calculated Risk on 5/29/2025 01:08:00 PM
What this means: On a weekly basis, Realtor.com reports the year-over-year change in active inventory and new listings. On a monthly basis, they report total inventory. For May, Realtor.com reported inventory was up 30.6% YoY, but still down 16.3% compared to the 2017 to 2019 same month levels.
Realtor.com has monthly and weekly data on the existing home market. Here is their weekly report: Weekly Housing Trends View—Data for Week Ending May 24, 2025
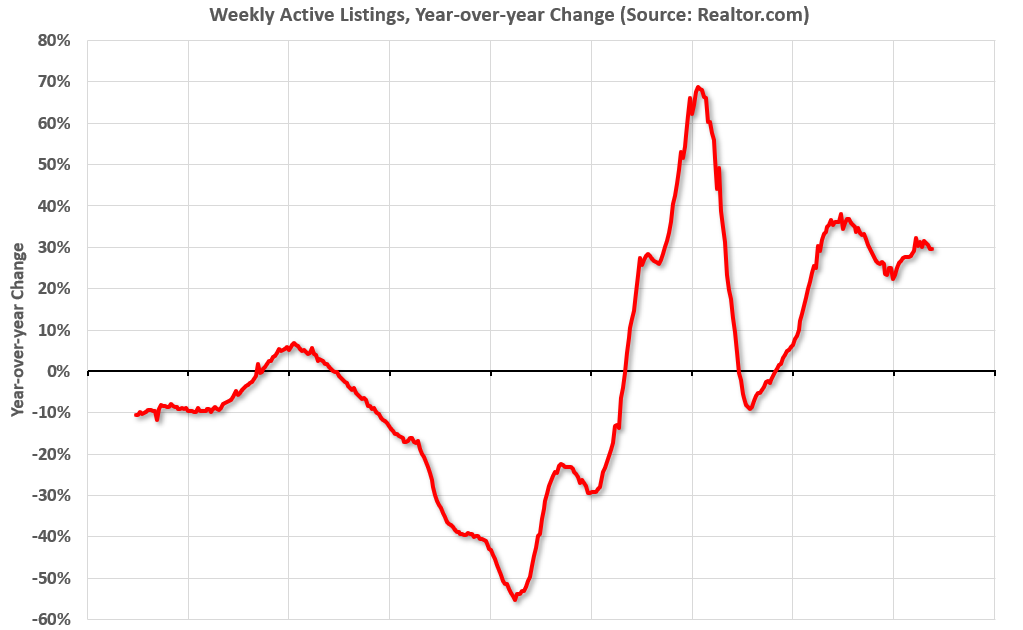
• Active inventory climbed 29.7% year-over-year
The number of homes actively for sale remains on a strong upward trajectory, now 29.7% higher than this time last year. This represents the 81st consecutive week of annual gains in inventory. There were more than 1 million homes for sale last week, the highest inventory level since December 2019.
• New listings—a measure of sellers putting homes up for sale—rising 8.2% year-over-year
New listings rose again last week, up 8.2% compared to the same period last year.
• The median list price was up 0.2% year-over-year
After a brief cooling period the previous week, the national median listing price resumed its upward trajectory last week. At the same time, the median listing price per square foot—which adjusts for changes in home size—rose 0.9% year-over-year.


Inventory was up year-over-year for the 81st consecutive week.
New listings were solid.
Median list prices were mostly unchanged year-over-year.