

Doji candlesticks come in several different shapes and sizes. The Doji candlestick pattern by itself is neutral. Dojis resemble a plus sign or a cross. Depending on the day’s price action, it can be red (bearish) or green (bullish). They could be found near support levels, resistance levels, or consolidation areas.


Candlesticks eBook & Wallpapers
Get eBook
Doji Candlestick Pattern Meaning
A doji candlestick has a small real body and looks like a plus sign on stock charts. Dojis are found near both support and resistance levels. The open and close prices are almost identical. They are typically black or a neutral color on a stock chart. Watch our video on how to trade them here.
A doji candlestick is an indecision candle. They show a tug-of-war between buyers and sellers. The price fluctuates during the trading day but closes near or at the opening price. Hence, a standoff occurs. Neither the bulls nor the bears were able to gain control that day. This suggests that a turning point may be developing in that stock.
Every candlestick has four points of data that define its shape. Based on the shape of the candlestick, a trader can infer the likely behavior of the stock’s price. For example, Doji candlesticks form when the opening and closing prices of a stock are equal for the day.
It’s a sign of a reversal pattern when coupled with technical analysis. Doji trading provides information on its own and as a part of a bigger pattern. Dojis are found in many patterns.


Basics
A doji candlestick can be both bullish and bearish. They can also be neutral or consolidation candlesticks that make up bull flags and bear pennant patterns. They look like a plus sign with a small real body. If the real body is larger, it would be considered a spinning top. Spinning tops tell a similar story to doji candlesticks. They are reversal or indecision candlesticks.
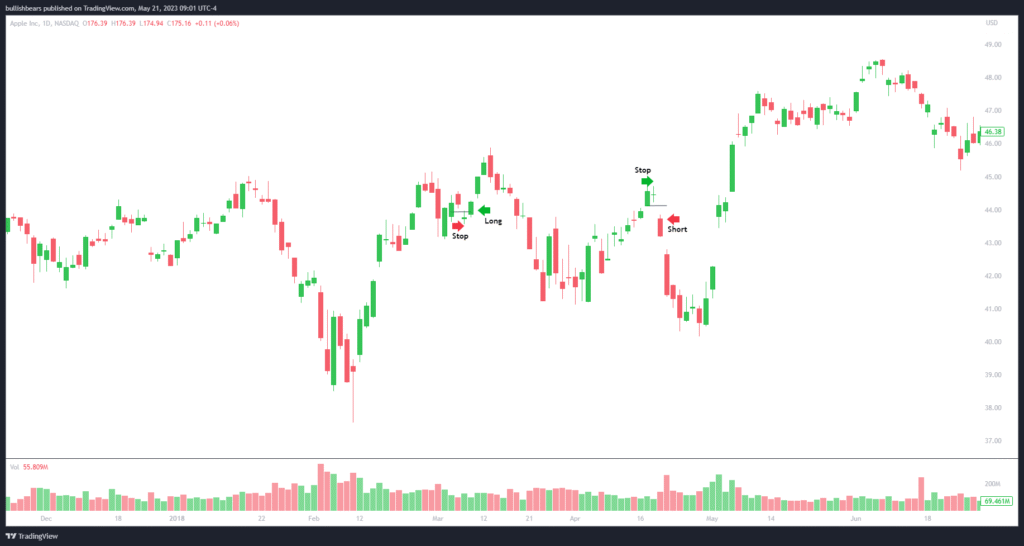
Traders would take a long position when the price breaks above the candlestick and use a candle close below as a stop. Traders would take a short position when the price falls below the base of the doji and use a close above as a stop.
Larger Patterns
Doji candlesticks make up larger patterns. Determining the meat of the real body of a doji depends on price, volatility, and the previous candlesticks. That might not seem significant, but it can be when you look at the candles around it.
Dojis can be part of continuation patterns, such as bull and bear flags. The large candlestick makes up the flagpole. The doji candlesticks make up the flag.
The indecision candles indicate that buyers and sellers are preparing for the momentum of the continued trend. The trend could continue in either direction, up or down.
Dojis are also a part of reversal patterns, such as the head and shoulders pattern. When the price breaks, the neckline support falls. Conversely, the price can increase if it’s an inverted head and shoulders pattern.
Doji Candlestick Trading Strategy
- Traders take a long position when the price breaks above the high of the doji candlestick
- They use a candlestick close below the low as a stop level
- Traders take a shot at the break of the low and use a candlestick close above the high as a stop
Doji Candlestick Pattern Example


This picture shows a bullish and bearish doji example on a daily chart of $D, Dominion Energy. The first example is a bear flag, with the doji signaling a bearish reversal. Traders would enter a short position once the price fails the flag and use a candle close above as a stop level.
The second doji example is found within a double-bottom pattern. It has a longer shadow, which could make it a long-legged doji. Traders would enter a long position when the price breaks above the top of the doji candle and use a candle close below as a stop level.

The picture of $CAT shows doji candlesticks to the upside and downside. The first example shows a doji at the base of a falling wedge pattern. The doji formed at the apex of the wedge, signaling a bullish reversal. Traders would take a long entry when the price breaks above the top of the doji candlesticks and use a candle close below the doji as a stop level.
The second example is a bearish doji near the top of a rising wedge pattern. This signaled a reversal to the downside. Traders would take a short entry when the price fell below the base of the doji and use a close above the doji as a stop level.
Doji Candlestick Failure
The upper wick and lower shadow show the high and low of the doji candlestick. If you are bullish on a stock, you want to see price action break and hold the top of the upper wick. If it fails and the price closes below the lower shadow, then it would be a bullish doji failure. Your stop loss would be placed below the base of the lower shadow.
If you are bearish on a stock, you want to see price action fall below the lower shadow. If it reverses and the price closes above the upper wick, then it would be a bearish doji failure. Your stop loss would be placed above the upper wick.
Final Thoughts
A doji candlestick can be found in both uptrends and downtrends. Be aware of a potential reversal when these candles form after a long trend in either direction.
In the picture above, take note of the first doji candlestick. You’ll see a prolonged downtrend on CAT on the daily chart. Then, a doji formed near the base of a previous support level, creating a double bottom pattern.
The green doji on the chart also looks like a spinning top candle. Spinning tops and dojis can look similar, but their real bodies are bigger than a doji candlestick. It’s essential to note that they often share a similar story, suggesting that the trend is about to reverse.
The first doji near support had separation, thus creating a star pattern. It ended up being a morning star reversal. The second doji candlestick at the top of the uptrend created a bearish harami pattern, a bearish reversal. Utilize proper risk management techniques when trading a doji candlestick pattern.
Frequently Asked Questions
Is a Doji Bullish or Bearish?
A doji can be interpreted as bullish or bearish, depending on whether it occurs in an uptrend or a downtrend. Typically, doji’s make up two candlestick patterns called star patterns. They often finish evening stars, which are bearish, and morning stars with bullish reversals.
What Is a Bullish Doji Pattern?
A bullish doji pattern is typically a reversal pattern found at either the base of a downtrend or near support levels. It will often be preceded by a bearish candlestick, followed by a bullish one, which completes a morning star reversal pattern.
What Is the Psychology Behind the Doji Candle?
The psychology behind the doji candlestick indicates that a reversal is about to occur in the stock trend. It can also mean that consolidation is happening before a continuation of the trend.