

by Calculated Risk on 5/26/2025 12:44:00 PM
Today, in the Calculated Risk Real Estate Newsletter: Final Look at Local Housing Markets in April and a Look Ahead to May Sales
A brief excerpt:
After the National Association of Realtors® (NAR) releases the monthly existing home sales report, I pick up additional local market data that is reported after the NAR. This is the final look at local markets in April.
There were several key stories for April:
• Sales NSA are down YoY through April, and sales last year were the lowest since 1995! Ouch.
• Sales SA were down YoY for the 3rd consecutive month and 40 of the last 44 months.
• Months-of-supply is at the highest level since 2016 (excluding one month near the start of the pandemic).
• The median price is barely up YoY, and with the increases in inventory, some regional areas will see more price declines.
Sales at 4.00 million on a Seasonally Adjusted Annual Rate (SAAR) basis were below the consensus estimate; however, housing economist Tom Lawler’s estimate was very close (as usual).
Sales averaged close to 5.4 million SAAR for the month of April in the 2017-2019 period. So, sales are about 26% below pre-pandemic levels.
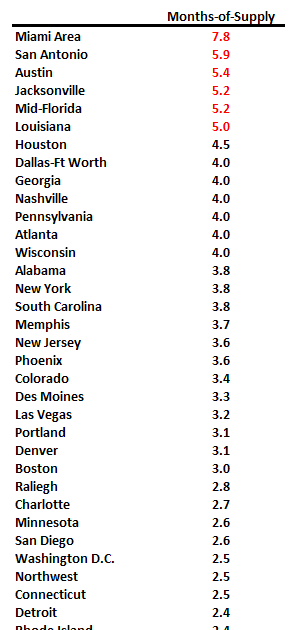
Also, months-of-supply for April was above pre-pandemic levels for the period 2017-2019 and the highest for April since 2016.
…Here is a look at months-of-supply using NSA sales. Since this is NSA data, it is likely months-of-supply will increase over the next few months. Months in red are areas that are seeing 5+ months of supply now and might see price pressures later this summer.
…
More local data coming in June for activity in May!


There is much more in the article.
